Performance
How long your workflows and jobs usually take, and which runner suits each job.
The Performance page, under Analytics, shows how long your workflows and jobs usually take over the past 24 hours, 7, 14 or 30 days, this week, last week, this month or last month. Times come from successful runs only, since a failed run stops early. The ⓘ beside each column explains how it’s worked out.
Workflows
Section titled “Workflows”For each workflow: its runs, the share that succeeded, and the median and p90 time from a run’s start to its last job finishing. That time includes any wait for a runner, so it’s what you actually wait for. Waiting is how much of that time no job was running, mostly jobs waiting for a runner.
Trend compares the range with the one before it: the past 7 days with the 7 days before, or this month with the same days last month. Red means the workflow got slower. Last month has no trend, since job history goes back two months. Slowest job is the job that usually takes longest. Open it to compare its times on each runner.
How long each job usually takes on each runner it ran on, fastest first. Use it to see which runner suits which job: a test suite that takes 2 minutes on your Mac and 9 on ubuntu-latest is a good one to route. A time from fewer than 20 runs reads “only 7 runs”: hover it to see how much to trust it. Open a job for a chart of every run.
Runners
Section titled “Runners”Each runner’s job count, median wait, median and p90 run time, and success rate.
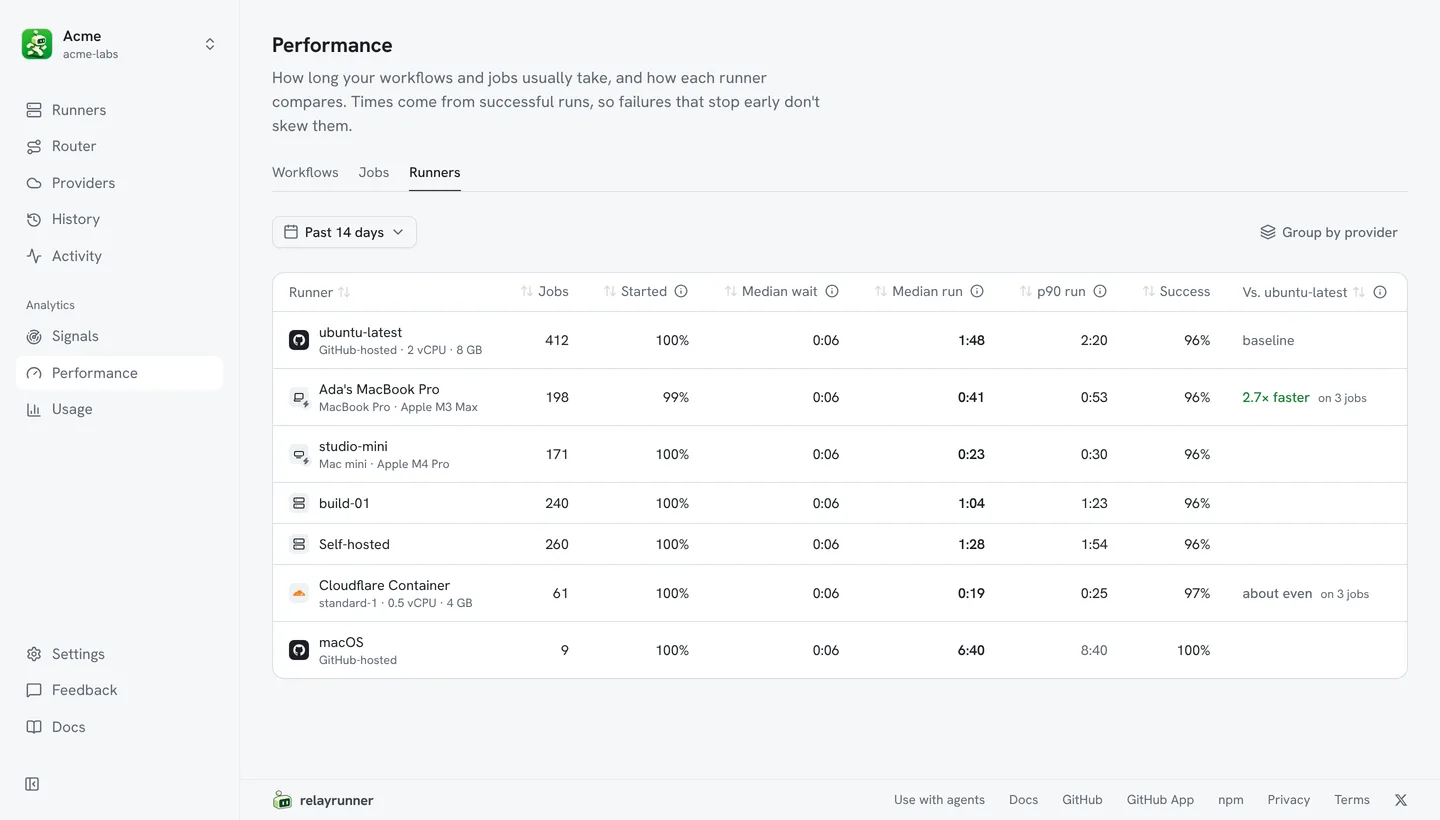
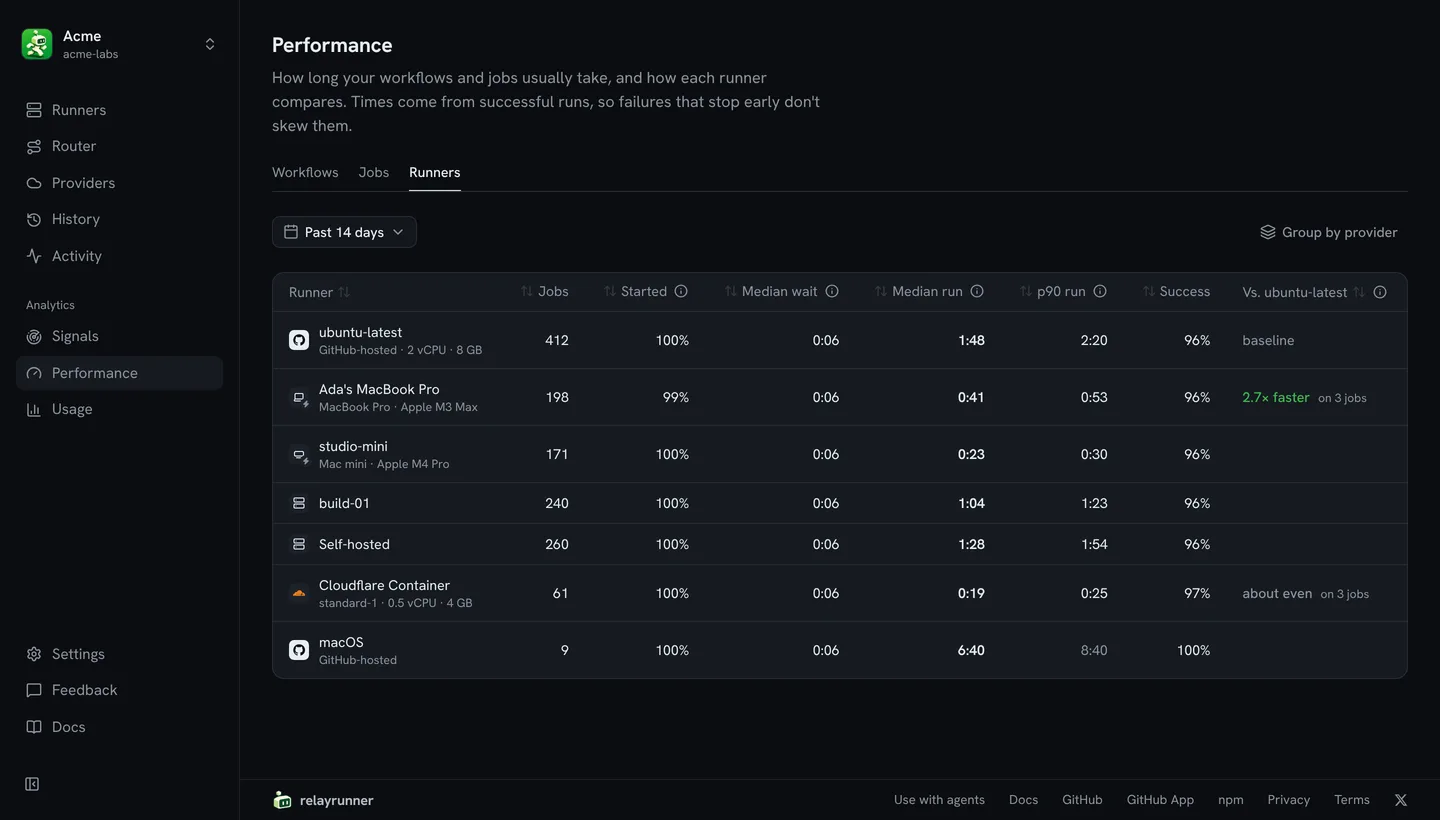
Started is how reliable the runner is, separate from your tests: the share of jobs sent to it that it picked up. A job counts as missed when it waited 10 minutes and no runner took it. A runner that missed every job still gets a row.
The comparison column lines up the jobs a runner shares with ubuntu-latest (or your busiest runner), so a runner that only takes quick jobs doesn’t look faster than it is.
Job types
Section titled “Job types”Where your CI time goes by what each job does: tests, builds, lint, end-to-end tests, deploys and everything else. The AI model sorts each job by its name, its workflow and its runner labels, and reads new jobs every hour. You see the run minutes and share for each type, with Change against the range before (except for last month). Open a type to see the jobs that take most of its time. The chart below shows the minutes on each day, stacked by type.
Jobs the model hasn’t read yet, or wasn’t sure about, count as Not sorted. Time spent waiting for a runner isn’t counted. If AI is off for your workspace, the tab asks you to turn it on in Settings.
Inside the jobs
Section titled “Inside the jobs”GitHub sends the start and end of each step when a job finishes, and the dashboard sorts each step into a phase by its name: Setup (the runner and setup-* actions), Checkout, Installs (such as npm ci or pip install), Cache (restoring and saving it), Work (the job’s own steps) and Cleanup. Overhead is the share of step time outside Work. Pick a type to see its minutes in each phase.
Open a job on the Jobs tab to see its average successful run step by step.
From an agent
Section titled “From an agent”Agents can read the same times through the MCP server, such as “which runner is fastest for test?”.